Microsoft 365 · SharePoint

PAnalytics for Microsoft 365
Analytics for SharePoint and your broader Microsoft 365 workplace. PAnalytics is a Privion-hosted service: we operate the platform so you get adoption insights for intranets, hubs, and sites without building or maintaining analytics infrastructure.
Core features
Dashboards, visitor intelligence, behavior analytics, and scheduled reports — one workspace across your SharePoint estate.
Why not just built-in analytics?
Native SharePoint usage reports vs. PAnalytics.
Built-in SharePoint
- Usage history capped at ~90 days
- Fixed windows — no custom date ranges
- No user or audience segments
- Per-site silos, no cross-hub view
PAnalytics
- Full history from day one
- Any date range, down to one day
- Segments by region, BU, or role
- One workspace across sites and hubs
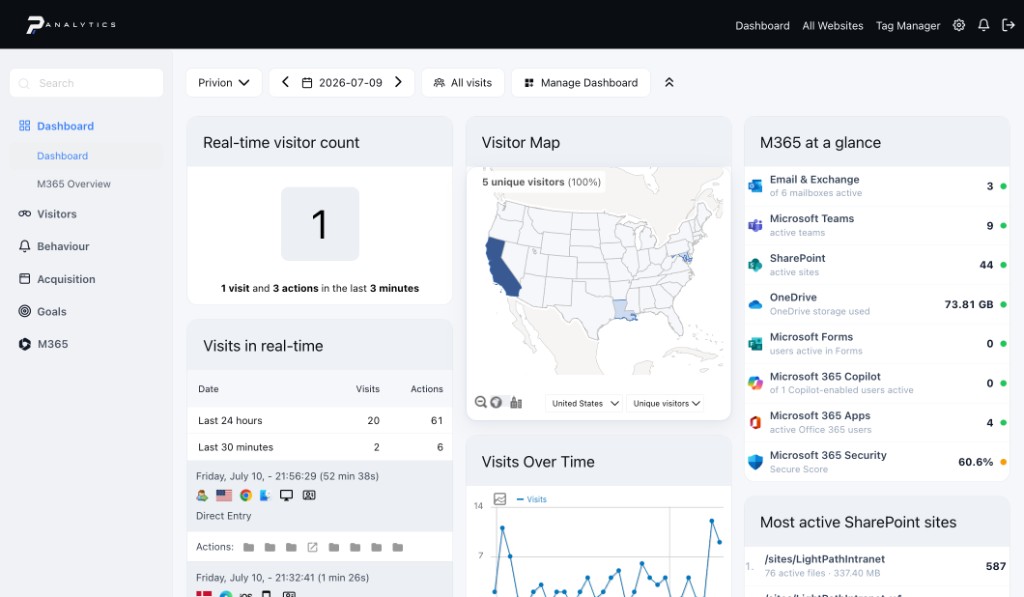
Dashboards
One dashboard, every metric
Your team lands on a dashboard built from widgets — one per metric. Customize it to the metrics that matter most, or create additional dashboards as needed.
Export widget data to Excel or CSV, or save any metric as an image. Annotate your timeline to mark events that shift visitor behavior, like an intranet launch date.
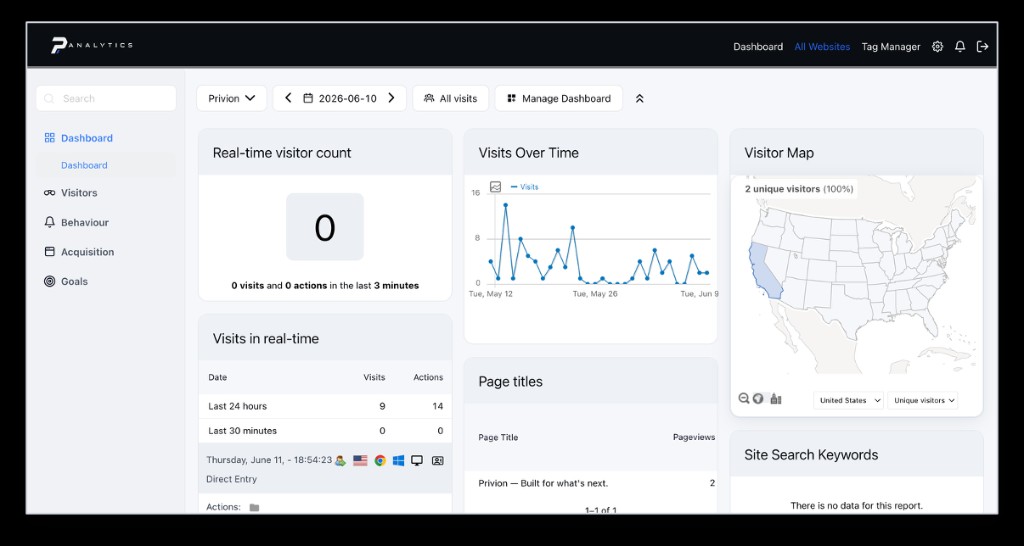
Visitors
Overview
The Visitors reports show the popularity of your sites: how many visits you receive over any period, and the average engagement on key actions like searches and downloads. Who is using your environment, where they are, and how they engage — adoption answered with hard data.
Visits log
Every visit in detail: actions taken, referral path, and visitor profile — while complying with local privacy regulations.
Real-time
Live flow of visits and page views over the last 24 hours and previous 30 minutes, refreshing every 5 seconds.
Engagement
Visit counts and engagement trends charted over any selected period.
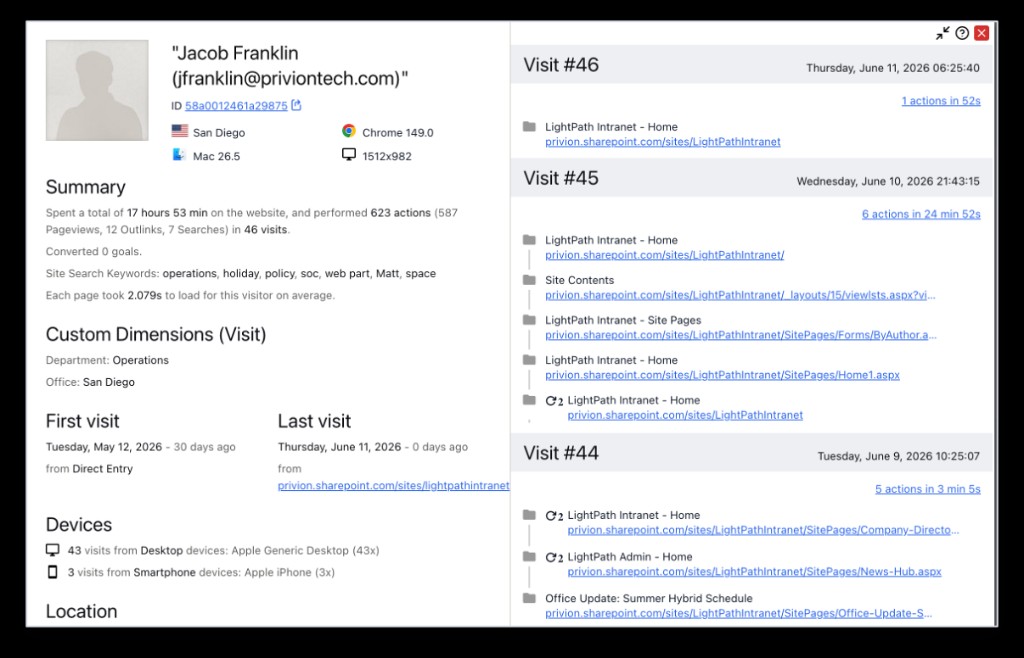
Every user, one profile
Per-user profiles are admin-controlled, aligned with your existing workplace data policies, with configurable retention.
Summary
Lifetime totals: time on site, actions, pageviews, and searches.
Custom dimensions
Department and office attached to every visit.
Visit log
Page-by-page detail for each session, with timestamps.
Devices
Desktop vs. mobile split, hardware, and location.
And the rest
Every other Visitors and Behavior report — same workspace, no separate tools.
Real-time map
Visitor locations over the last 30 minutes, refreshing every five seconds.
Locations
Countries, regions, and cities in table and map form.
Times
Popular local and server times for content and maintenance windows.
Devices
Device types and models your audience actually uses.
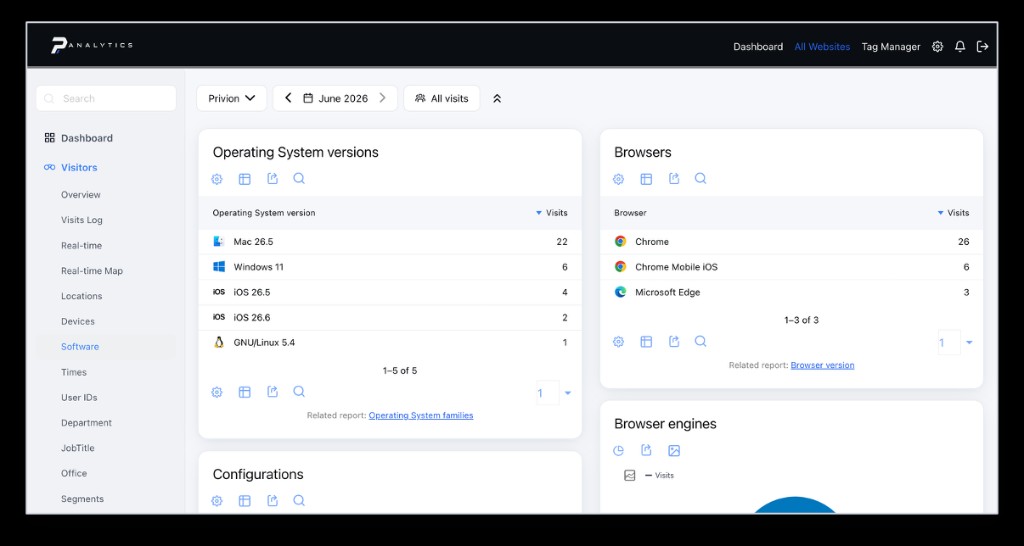
Software
Operating systems, browsers, and plugins in one view.
User IDs
Tie visits to logged-in users — most and least active at a glance.
Pages
Every visited URL, organized as a folder hierarchy.
Entry pages
The first page a visitor views in each session.
Exit pages
The last page before a visitor leaves.
Outlinks
Clicks that take visitors to another domain.
Downloads and site search
Downloads shows which files your visitors download, and how often.
Site Search shows the keywords visitors use, the pages they view after searching, and the searches that return no results at all.
Together these reports surface missing content and resources your visitors want but cannot find easily.
Automated reports
Automated email reports
Skip the portal — configure a custom report and have it delivered on a schedule.
Segment
Scope the data, e.g. intranet sites only versus all of SharePoint.
Cadence and period
How often the report is sent, and the window of data it covers.
Recipients
Who receives the report by email.
Display options
How the data is represented.
Metrics
Which metrics to include, selected from a checklist.
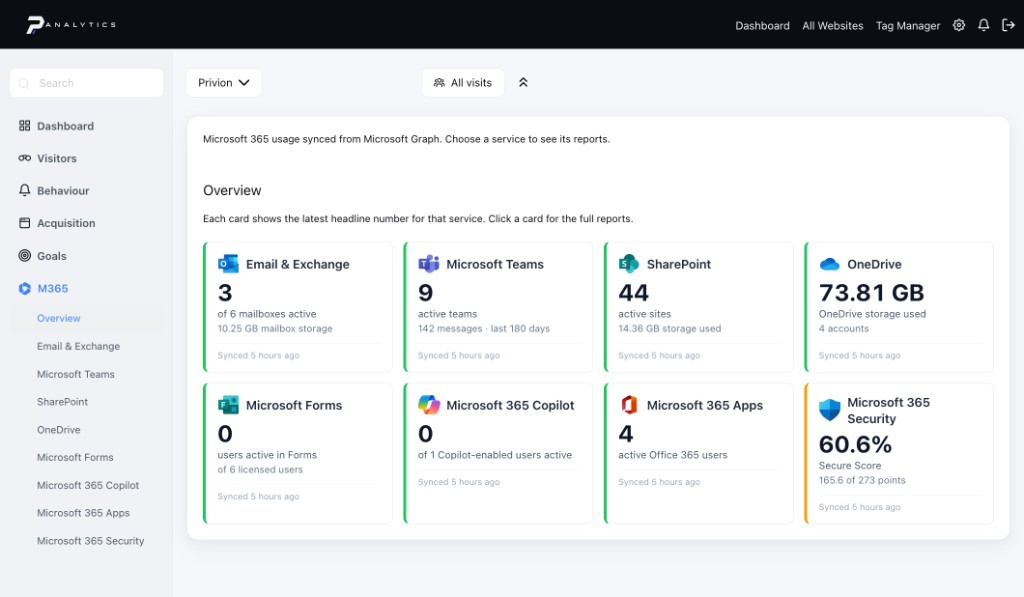
Microsoft 365
Beyond SharePoint
Seven service families — Exchange, Teams, SharePoint, OneDrive, Forms, Copilot, and M365 Apps — synced from Microsoft Graph.
Per-user detail: mailbox activity, meetings and chats, file sharing, and Copilot adoption by host app.
Sync status at a glance: last run and health for every report family on one card view.
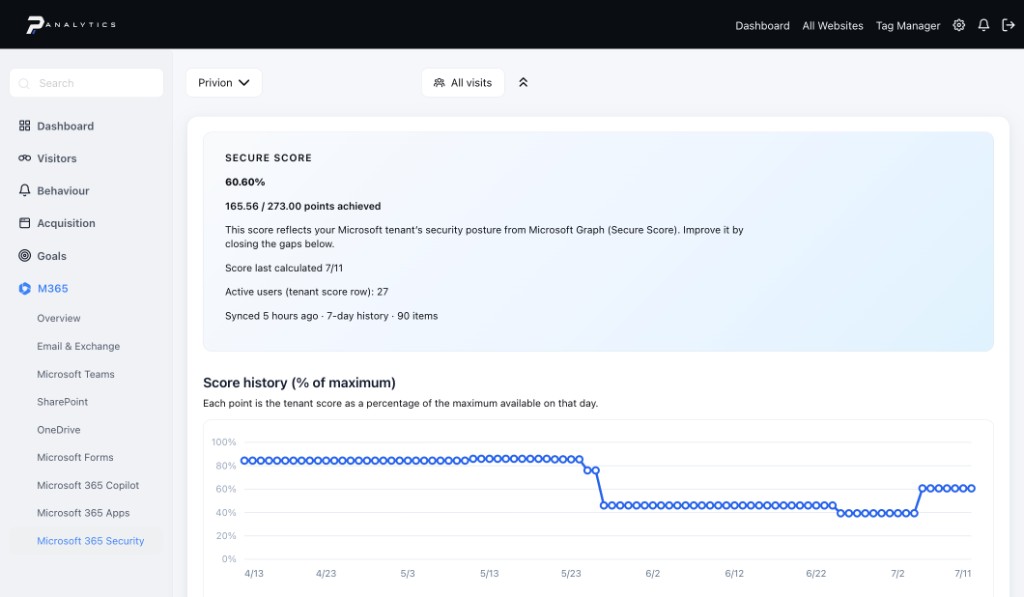
Microsoft 365
Security posture, tracked daily
Your tenant’s Microsoft Secure Score synced from Graph, with daily history to spot drops the moment they happen.
Apps, Data, and Identity scored separately so you know where the gaps are.
Every control below max points, with threats addressed and remediation steps inline.
A service, not a stack
Hosted and operated by Privion — nothing for your team to stand up or patch
Privion-hosted
We run the measurement stack as a service; your team gets the insights without the maintenance.
Intelligent segments
Custom user properties from Entra, HR, or your own systems roll visits into real audiences — region, business unit, role, cohort.
Governance-ready
Measurement aligned with how you already treat workplace data: where it lives, who can see it, and how long you keep it.
Proven engine
Built on Matomo — a mature, auditable platform you can explain to security and legal.
Ready when you are
30 minutes to scope it — live demo on your tenant, no fluff.